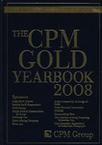
The CPM Gold Yearbook 2008CPM黄金年鉴 2009
2008-3
John Wiley & Sons (2008年3月21日)
CPM Group
209
Written by Wall Street’s top commodity research firm, The CPM Gold Yearbook 2008 provides in-depth statistics, analysis, and forecasts for gold. The supply and demand fundamentals of this commodity are displayed in detailed charts and graphs, providing you with the information needed to make fully informed investment decisions. Filled with invaluable reference data, The CPM Gold Yearbook 2008 is a focused guide that will help you succeed in this dynamic market.
Review and Outlook Chart: The Price of Gold Chart: Supply/Demand Balance Chart: Investment Demand's Effect on Gold Prices Chart: Gold Statistical Position Table: Gold Cycles - Trough to Peak Chart: Central Bank Gold Holding and Investor Gold Holdings Chart: The Gold Market 1997--2007 Chart: Annual Total Supply Chart: Annual Total Demand Chart: Official Transactions Chart: World GDP Table: The Economy Chart: United States Real GDP Chart: SandP 500 Price to Earnings Ratio Chart: M1 Money Stock Chart: M2 Money Stock Chart: United States Real GDP Since 1850 Table: U.S. Business Cycle Expansions and Contractions Table: Long-Term Supply and Demand Table: Real and Nominal Gold Prices Chart: Cumulative World Production and Distribution Fundamentals Investment Demand Chart:Investment Demand's Effect on Gold Prices Chart: Investment Demand's Share of the Gold Market Chart: Change in Combined Gold ETF Holdings Chart: Exchange Traded Fund's Physical Gold Holdings Table: Exchange Traded Fund's Physical Gold Holdings Chart: Private Bank Deposits and Gold Holdings Table: World Financial Assets Table: Factors Determining Investment Demand for Gold Table: Correlations Chart: Gold and the U.S. Dollar Chart: Gold and U.S. Inflation Chart: Real and Nominal T-Bill Rates and Gold Prices Chart: Gold and U.S. T-Bonds Chart: Gold and Oil Price Chart: The Gold - Oil Ratio Chart: Gold and the S&P 500 Chart: Gold and the CRB Chart: Gold Prices in Different Currencies Chart: Gold Prices in Different Currencies Chart: Comparative Investments Chart: Financial Times Gold Mines and World Stock Indices Chart: Gold Prices and the XAU Chart: Net Position of Large Speculators in the Gold Market & Gold Prices Chart: Monthly Gold American Eagle Sales Table: U.S. Eagle Gold Coin Sales Table: Official Gold Coin Fabrication Table: World Gold InvestmentSupply Chart: Annual Total Supply Chart: Mine Output in Major Gold Producing Market Economies 1992--2008p Table: Major Market Economy Gold Producers Chart: Total Worldwide Metal Exploration Expenditures Chart: Estimated Gold Production Additions Chart: The Price of Gold and Cash Operating Costs of Production Chart: The Price of Gold and Cash Operating Costs of Production Table: Near-term Gold Mine Development Projects Table: Gold Mine production by Company Chart: Transitional Economy Mine Production Chart: Annual Gold Recovery and Average London Gold Price Table: Secondary Supply Table: Production Costs in South Africa by Mine Chart: Gold Mine Output in South Africa Chart: Average Quarterly South African Working Costs and Ore Grade Chart: Average Quarterly South African Working Costs in U.S. Dollars Chart: Quarterly South African Gold Production - Ore Milled Chart: Rand Price and Ore Grade Chart: Refined Production Table: Global Production Since 1800 Table: Mine Production by Country ……Official TransactionsFabrication DemandMarketsPrices

The CPM Gold Yearbook 2008CPM黄金年鉴 2009 PDF格式下载
本书从比较客观的角度对黄金作为投资产品进行了研究,可作为对其在投资组合中的配置的参考。